

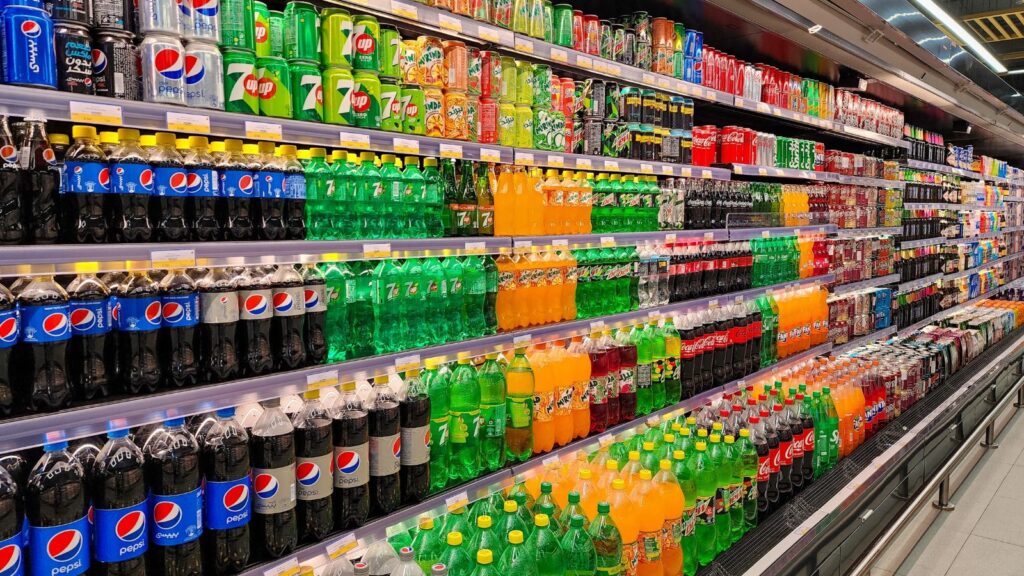
Fizzy beverages are among the most popular drinks in South Africa, but rising health concerns about their high sugar content and the health promotion levy (HPL) have transformed the soft drink industry.
South Africa offers a diverse selection of fizzy drinks, including various types and flavours. The country’s robust social culture features numerous events and gatherings where these soft drinks are often served and consumed.
A Deep Market Insights analysis indicates that the South African soft drinks sales market was valued at approximately $1,951.75 million in 2025, which is around R32.5 billion at current exchange rates.
Furthermore, this value is projected to grow to $2,936.37 million by 2034, which is equivalent to R48.41 billion at current conversion rates.
The market is expected to grow at a compound annual growth rate of 4.61% from 2026 to 2034.
By the end of 2025, carbonated soft drinks held the largest share of the market by type. This category is anticipated to continue driving growth, with the fastest compound annual growth expected during the forecast period.
Due to their popularity and the addictive effects of sugar, fizzy drinks faced criticism in South Africa, leading to the introduction of the health promotion levy (HPL) in 2018.
This tax, commonly referred to as the “sugar tax,” was an initiative by the South African government to combat the country’s growing diabetes epidemic and the high obesity rates that contribute to it.
In 2018, diabetes was recorded as the second-largest cause of death among South Africans after Tuberculosis (TB).
In addition, nearly 900 million adults were reported as living with obesity across the globe in 2022.
In Africa, the World Health Organisation (WHO) reported that South Africa had the highest proportion of obese adults in 2022, and by 2023, the WHO indicated that more than a quarter of South Africans were obese.
The implemented sugar tax and the growing health consciousness among South African consumers have significantly affected the soft drink market.
Currently, the sugar tax is applied to non-alcoholic sugary beverages that contain more than 4 grams of sugar per 100 millilitres, resulting in an increase of about 10% on the cost per litre of these drinks.
As a result, producers have been prompted to reduce the sugar content in their soft drinks to avoid the tax, while also passing on the price increases to consumers by raising retail prices.
A scientific evaluation conducted in 2022 assessed the impact of the tax in South Africa and revealed that consumers had already begun purchasing 29% fewer sugary drinks.
BusinessTech examined nearly 40 fizzy drinks available in South Africa to determine the specific sugar content per serving (100 millilitres).
The analysis found that Sparletta’s Iron Brew increased its sugar content from 3.5 g per 100 ml in 2023 to 8.4 g per 100 ml in 2026.
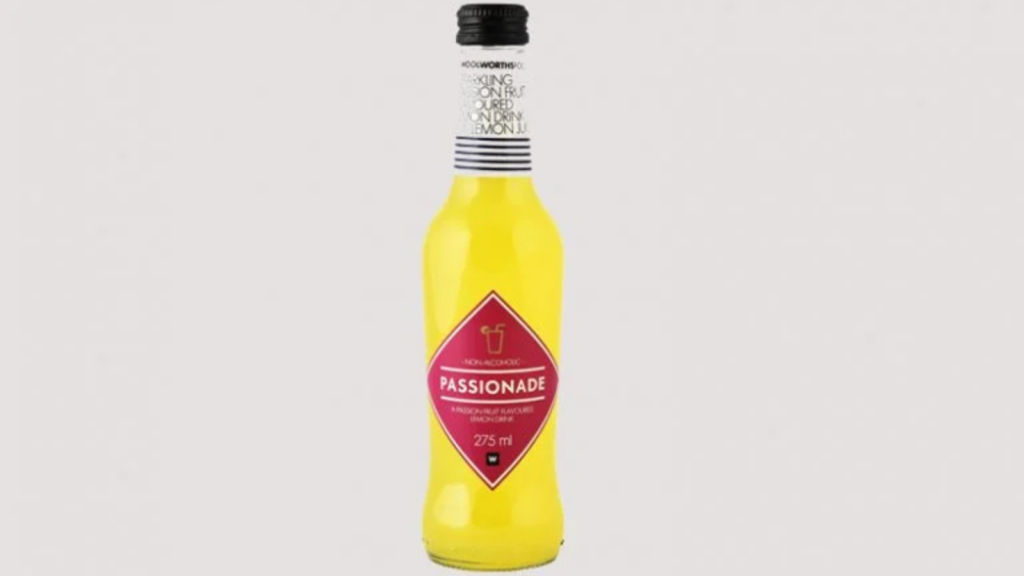
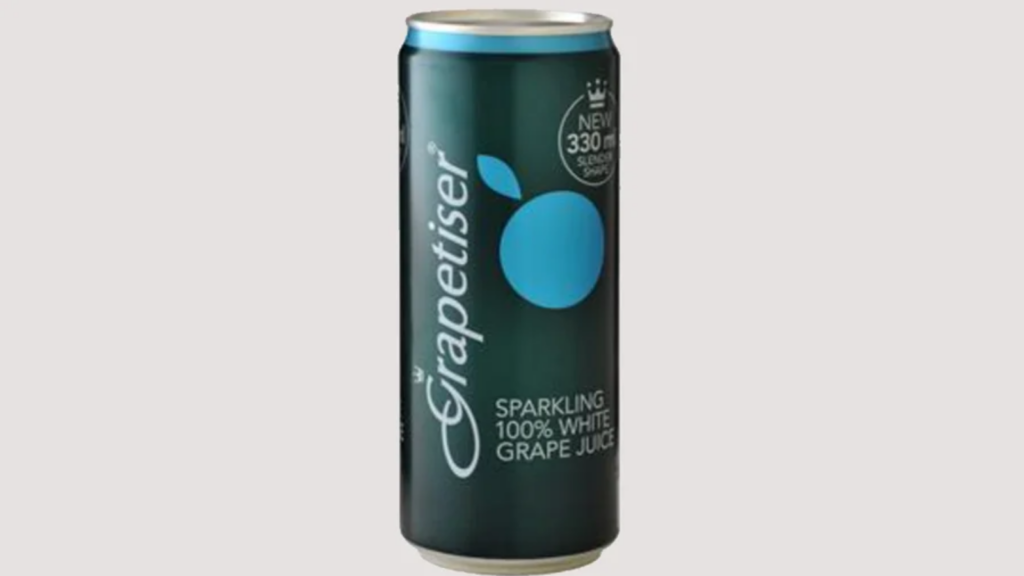
From the list, Woolworths’ Passionade has the highest sugar content at 13.4 g per 100 ml, followed by Appletiser’s White Grapetiser at 12.5 g per 100 ml. Coca-Cola’s Sprite has the lowest sugar content at 3.1g per 100 ml.
Woolworths Passionade – 13.4g per 100 ml
White Grapetiser – 12.5g per 100 ml
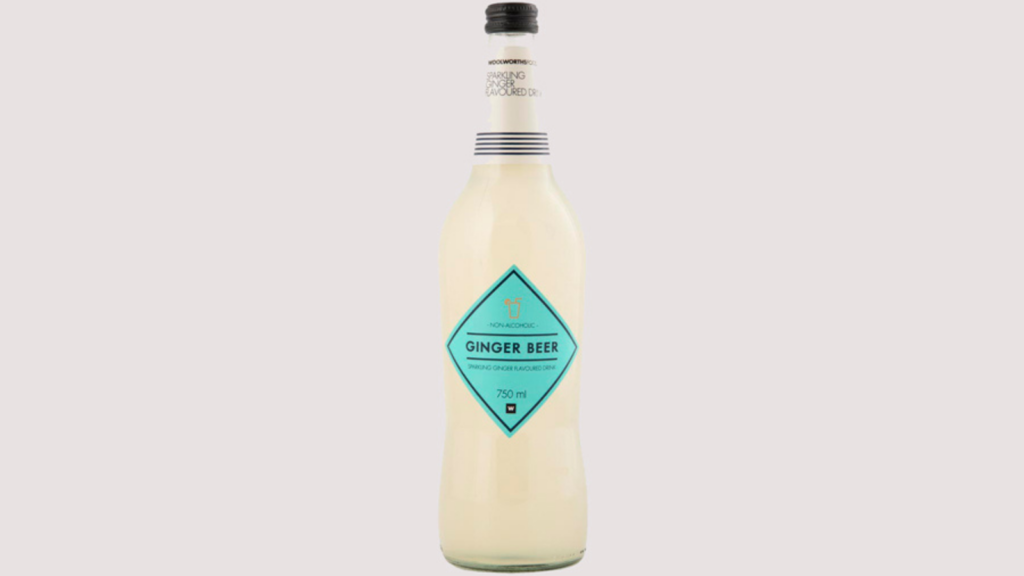
Woolworths Ginger Beer – 12.3g per 100 ml
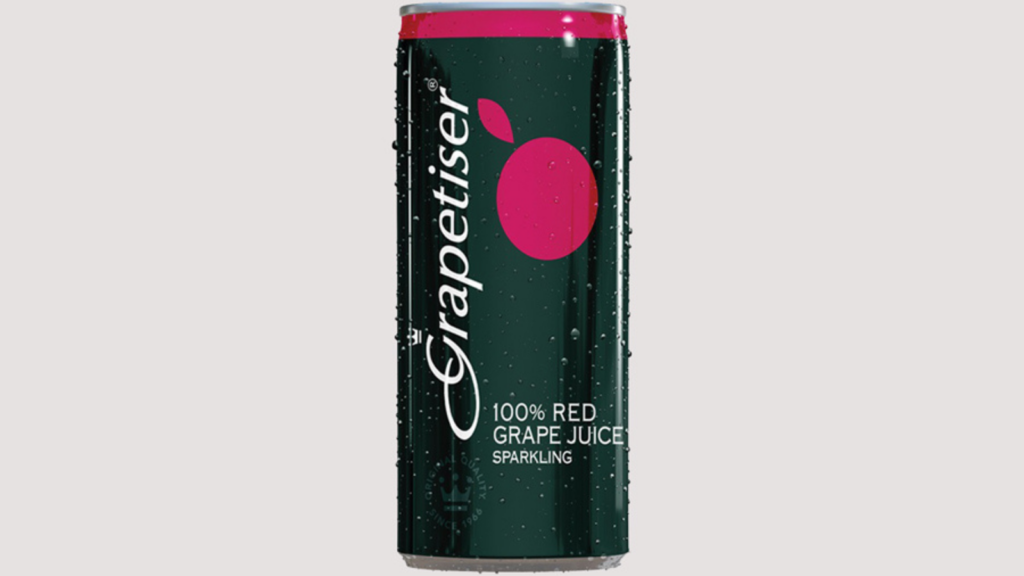
Red Grapetiser – 12.3g per 100 ml
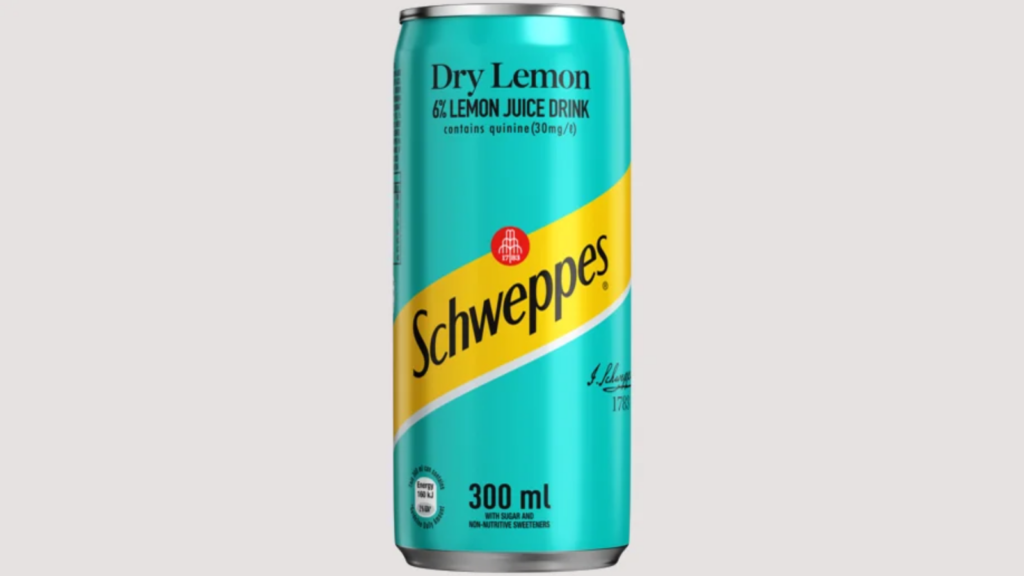
Schweppes Dry Lemon – 11.0 g per 100 ml
Below is an updated list of the sugar content in South Africa’s popular fizzy drinks in 2026.
| Brand | Soft Drink | Sugar Content (g) |
| Woolworths | Passionade | 13.4 |
| Appletiser | White Grapetiser | 12.5 |
| Appletiser | Red Grapetiser | 12.3 |
| Woolworths | Ginger Beer | 12.3 |
| Schweppes | Dry Lemon | 11.0 |
| Woolworths | Mint Mojito | 10.8 |
| Woolworths | Ruby Grapefruit | 10.8 |
| Woolworths | Peach Soda | 10.7 |
| Woolworths | Cranberry Cosmo | 9.9 |
| Appletiser | Appletiser | 9.6 |
| Schweppes | Indian Tonic | 8.9 |
| Coca-Cola | Stoney Ginger Beer | 8.4 |
| Sparletta | Iron Brew | 8.4 |
| Coca-Cola | Coke | 7.5 |
| Coca-Cola | Fanta Pineapple | 7.5 |
| Woolworths | Lemon Soda | 7.0 |
| Mountain Dew | Citrus Blast | 7.0 |
| Pepsi | Pepsi Cola | 7.0 |
| Fitch & Leedes | Blue Tonic | 7.0 |
| Woolworths | Pina colada | 6.6 |
| Coca-Cola | Fanta Grape | 6.4 |
| Schweppes | Ginger Ale | 6.3 |
| Bos | Peach Ice Tea | 5.9 |
| Bos | Lemon Ice Tea | 5.8 |
| Coca-Cola | Fanta Orange | 5.7 |
| Bos | Berry Ice Tea | 5.6 |
| Bos | Lime and Ginger Ice Tea | 5.5 |
| Woolworths | Rock Shandy | 4.9 |
| Fitch & Leedes | Pink Tonic | 4.8 |
| Lipton | Peach Ice Tea, Mixed Berries | 3.9 |
| Lipton | Lemon Ice Tea | 3.8 |
| Sparletta | Crème Soda | 3.7 |
| Sparletta | Apple Rush | 3.7 |
| Sparletta | Sparberry | 3.6 |
| Sparletta | Pine Nut | 3.6 |
| Twist | Lemon | 3.6 |
| Twist | Granadilla | 3.5 |
| Coca-Cola | Sprite | 3.1 |
Note: The listed sugar content per 100 ml in the table above was taken from the nutritional information presented on the product or the information on the brand’s website.
